Can you build an affordable house in Auckland? Media debate suggests that rising construction and land costs, together with the costs of meeting planning regulations, are making this extremely difficult. The debate, however, largely rests on either anecdotal evidence or modelled data.
Beacon and NZIER set out to provide a firm empirical basis for understanding the costs of delivering affordable new builds. Focusing only on Auckland, we gathered cost data from five builders / developers, covering 69 affordable and social homes built in 2015.
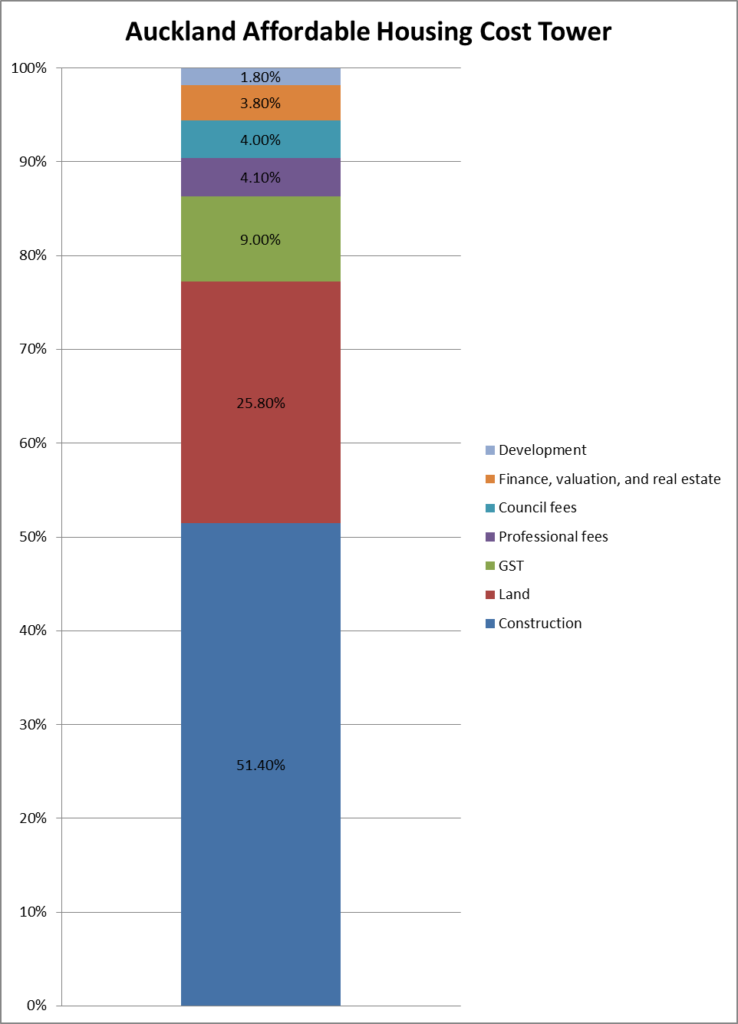
We worked with the builders and developers to agree on the seven key components of a housing cost tower:
- Land cost
- Land development & infrastructure costs (Valuation, Council LIM, Offsite infrastructure (e.g. stormwater), Excavation / siteworks, Road works, Fencing, Pathways, Demolition, Disconnections)
- Professional fees (Urban design / concept design, Architecture, Planning, Engineering / infrastructure, Landscape design, Project management, Other (ecology, acoustic etc..), Legal, Insurances)
- Construction costs (Materials, trades, builders margin, developer overhead)
- Council and consenting costs (Subdivision consent, Resource Consent, Development contribution, Other Council costs, Watercare/ Veolia, Building Consent)
- Finance, valuation and real estate costs (Finance Costs, Sales & Marketing, Real Estate fees, Legal / Conveyance, Valuation)
- GST.
The results
The striking thing about the results was that land costs amounted to only 25% of total costs and the Council consenting costs were only 4% of total costs. Unsurprisingly, construction costs dominate the Cost Tower at 51% of total costs.
This indicates that the best place to save costs is within construction and land rather than in other areas.
When we look at the differences between the lowest quartile and the top quartile, we see huge variances in construction and land development costs but less variance for land cost. The lowest quartile of house construction costs (an average $184,644) were $193,000 less than the top quarter of houses (an average $378,418). Even given the potential differences in number of bedrooms, the cheaper houses were built for a surprising 51% less. On a per square metre basis, construction costs ranged from a lowest quartile median of $1,617 psqm to $2,569psqm in the top quartile.
Land development costs also showed a wide variance – the lowest quartile paying only $8,111 compared to $24,503 in the top quartile.
This suggests that there is potential to identify savings in both these areas, and given how much construction contributes to costs, even a 10% saving could net the top quartile of houses over $30,000 in cost reduction.
This preliminary study has developed a useful standard format for comparing costs, and it gives builders a structure in which to identify, categorise and analyse their own costs e.g. separating design costs for development of land from engineering and planning of house. Understanding more about where costs are falling can only help in identifying where there are opportunities to reduce costs and improve efficiency and margins while delivering more affordable housing.